Real-Time Dashboard
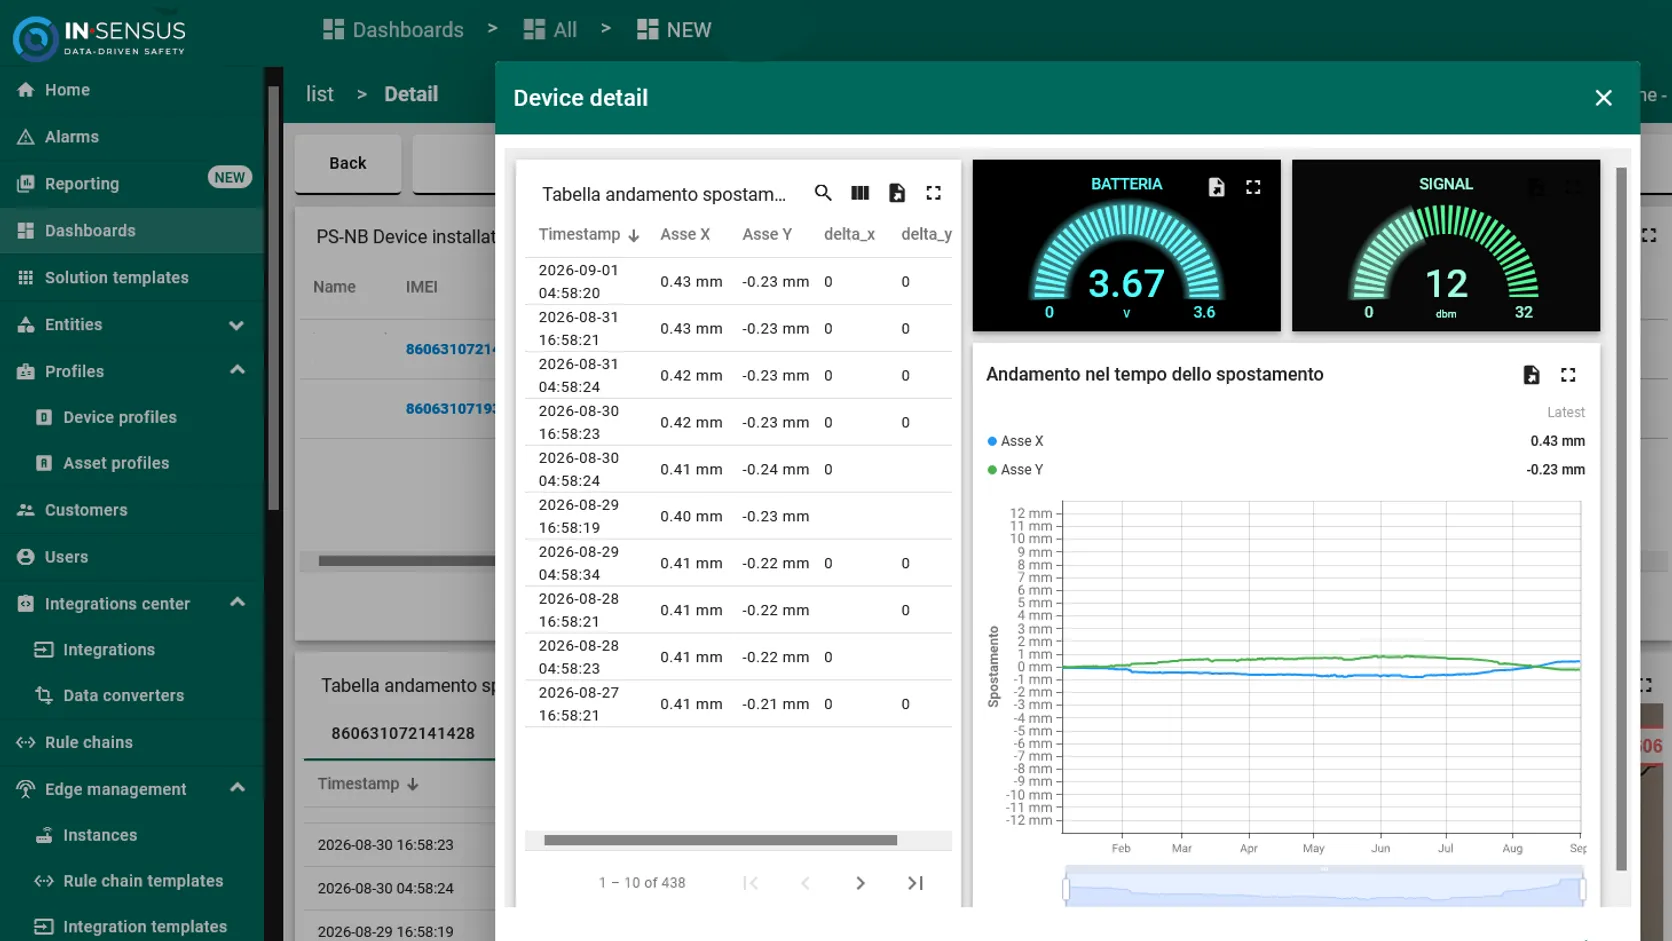
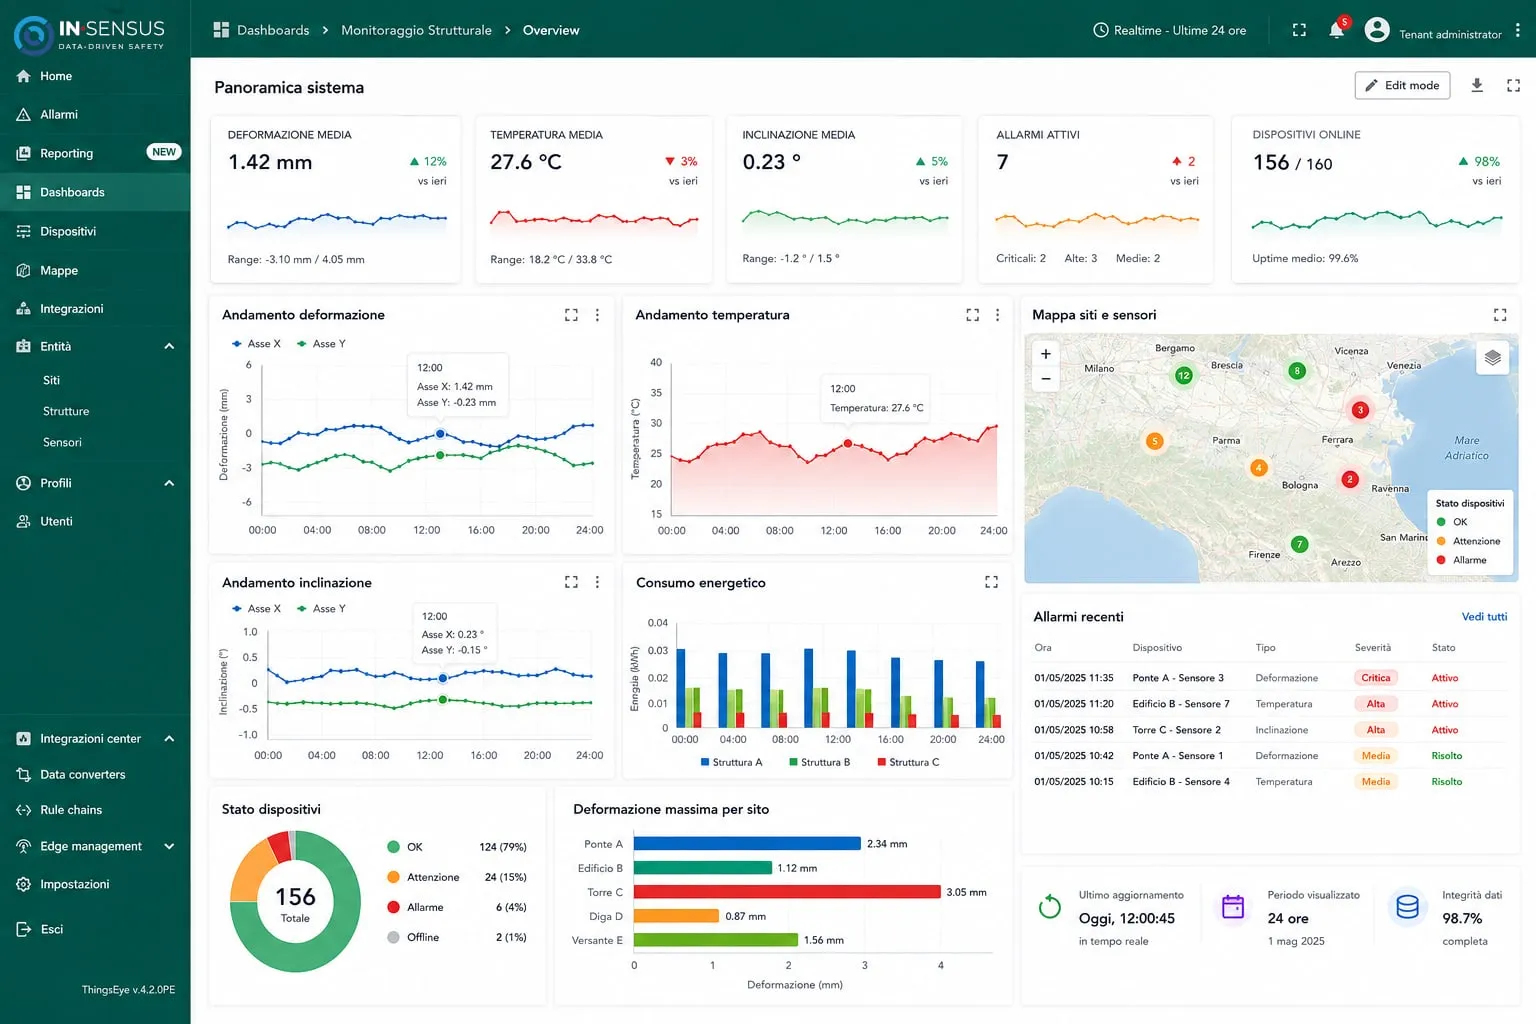
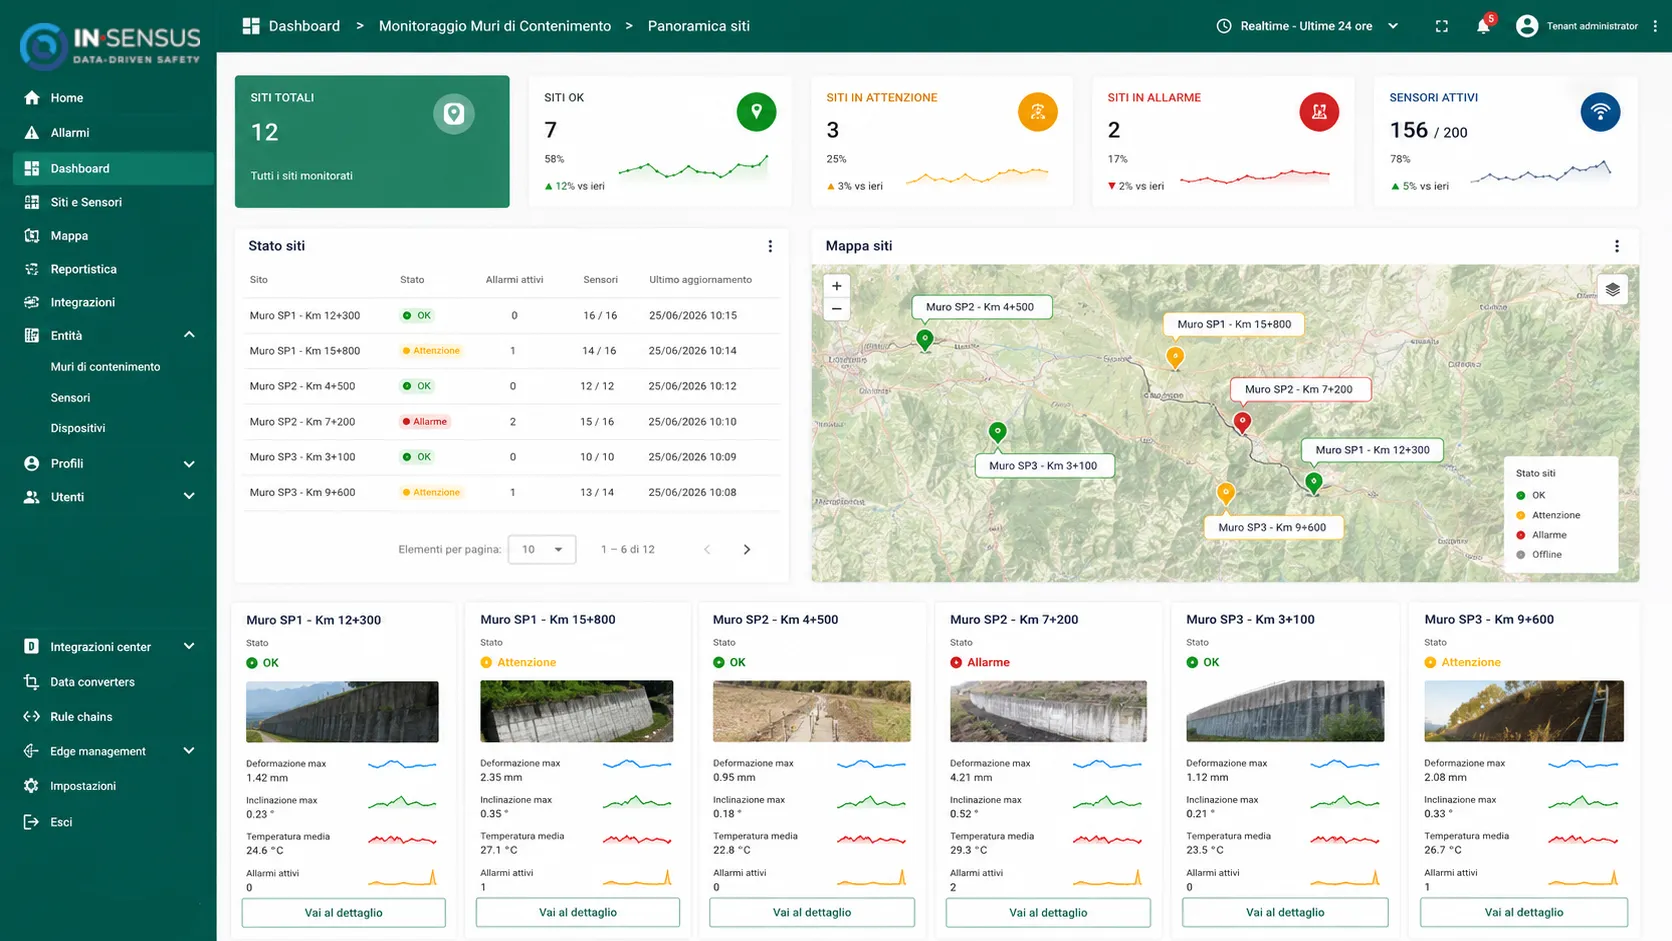
Every InSensus sensor, regardless of the installed product, feeds into a single dashboard: charts, tables, and maps display data in real time, with historical data available and comparable over time for each measurement point.
Products — Structural Health Monitoring
The platform that collects, visualizes, and alerts: real-time dashboards, customizable thresholds, and a mobile app to remotely monitor all InSensus sensors, across any product and site.
Multi-site
Manage multiple installations from a single platform
Real-time
Continuously updated data and notifications
Multi-user
Differentiated permissions per user and customer
The system
Cloud & App is the software layer shared by every InSensus system: data from each sensor, whatever the installed product, flows into a single platform, accessible from desktop and smartphone.
Every InSensus sensor, regardless of the installed product, feeds into a single dashboard: charts, tables, and maps display data in real time, with historical data available and comparable over time for each measurement point.
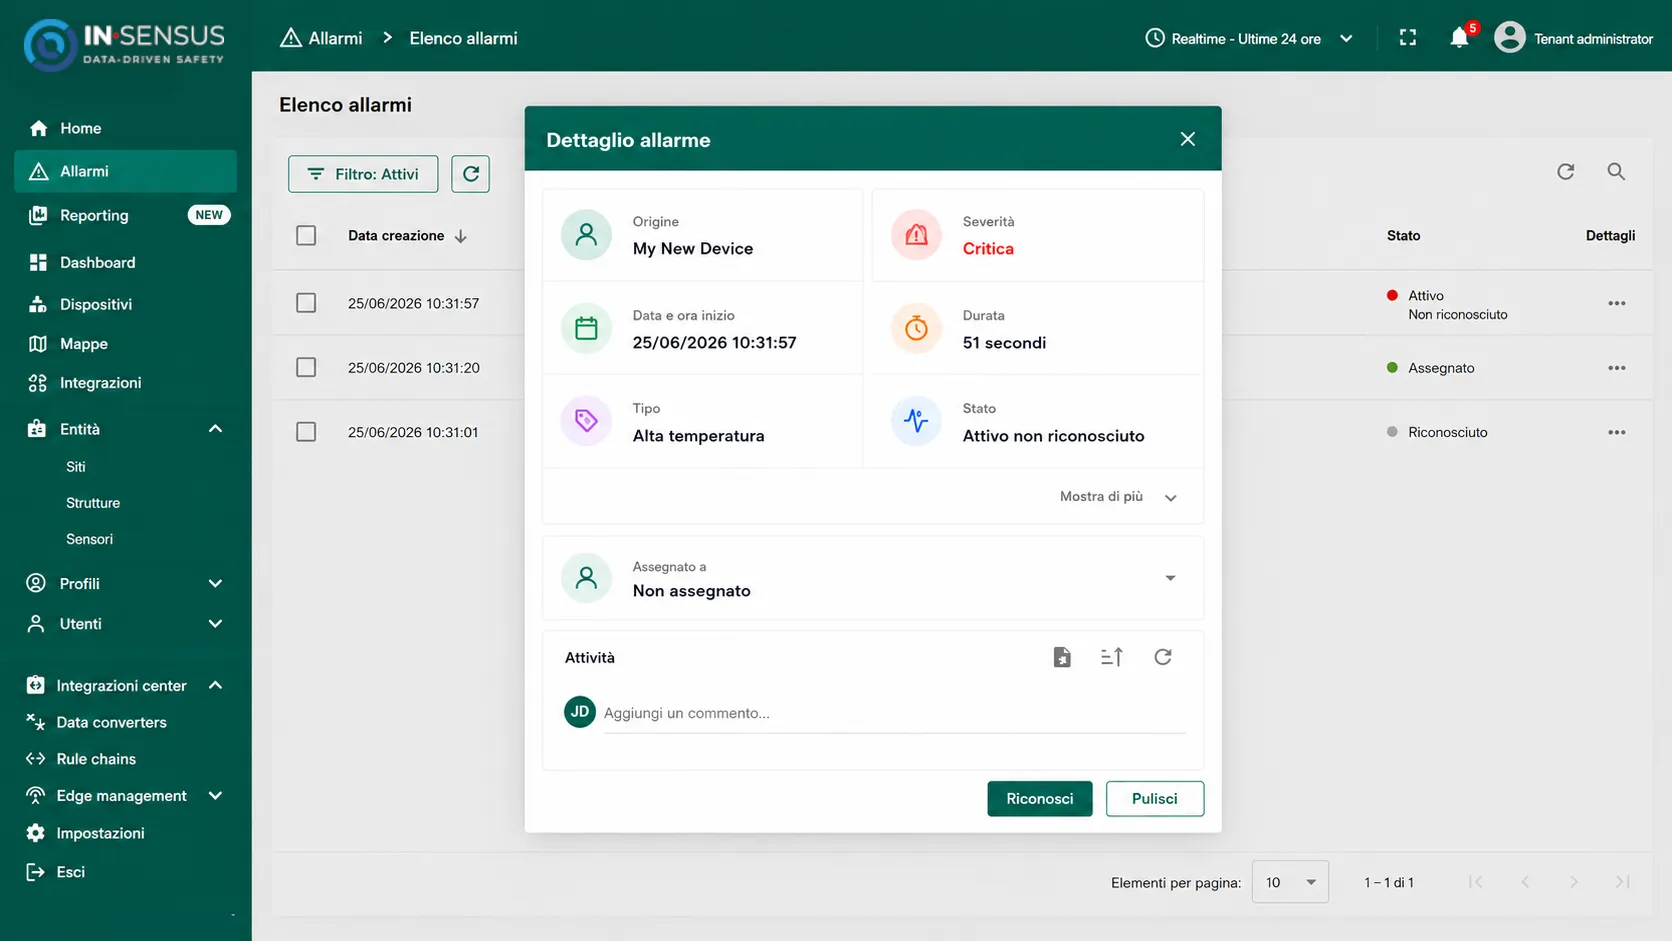
Each parameter can have a configurable alert threshold. When exceeded, the platform generates an automatic notification, with differentiated severity levels to immediately identify what requires urgent attention.
Dashboards and alerts are also accessible from a smartphone, with push notifications when a threshold is exceeded: monitoring stays available wherever you are, not just from a fixed workstation.
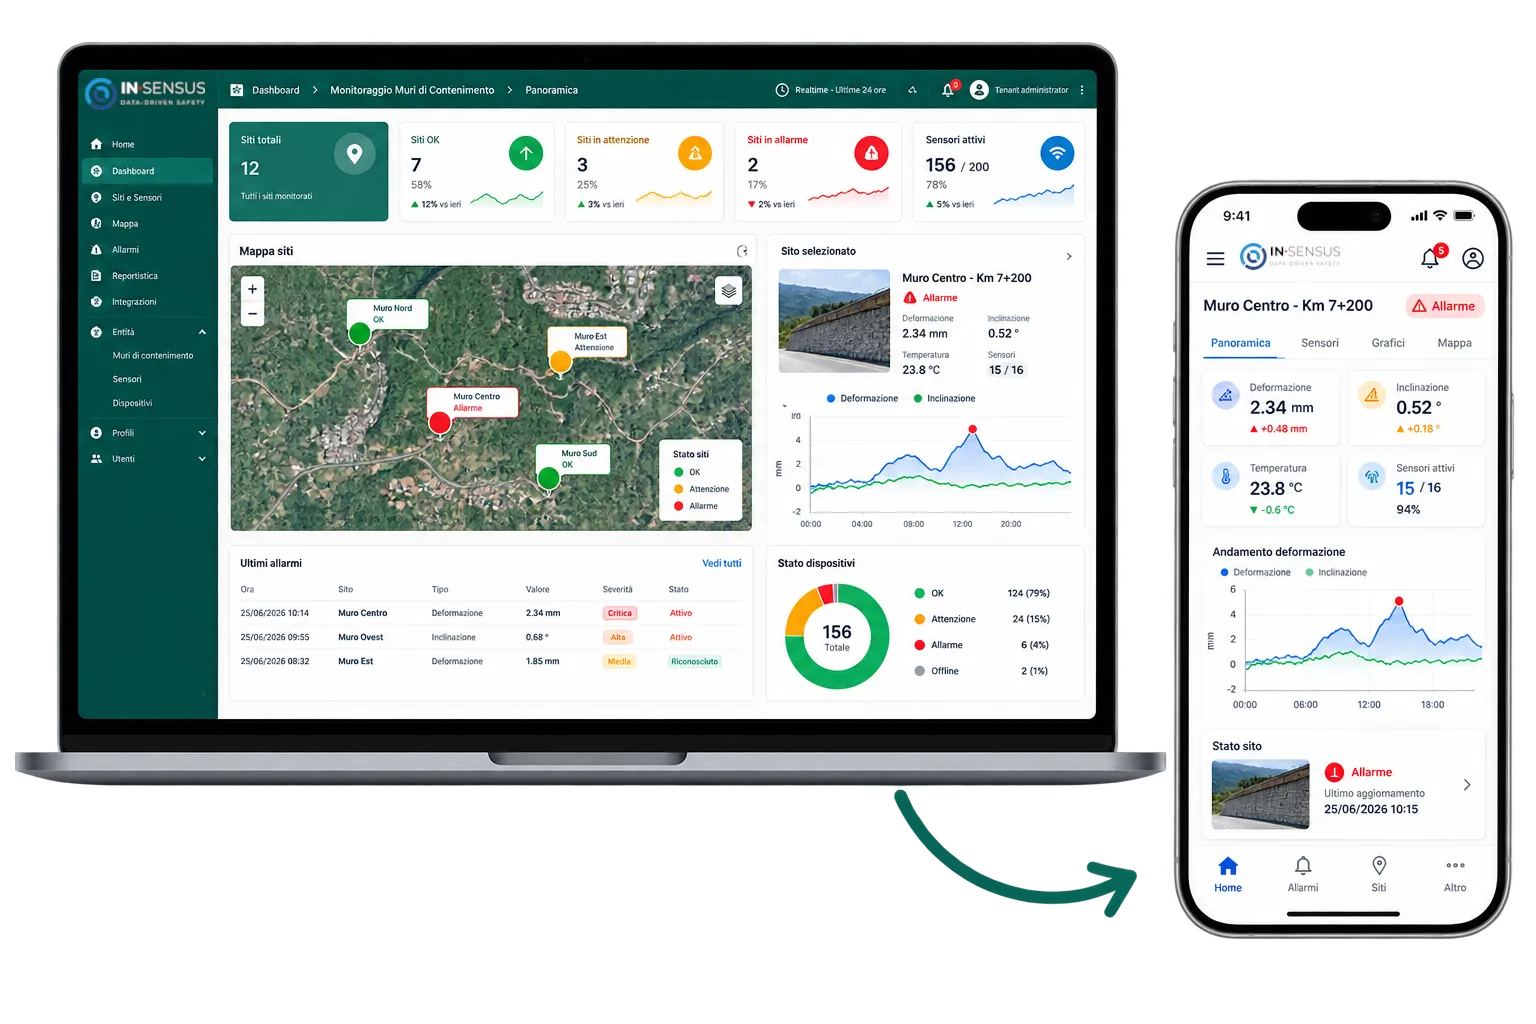
A single platform manages multiple installations and multiple customers, with differentiated permissions per user. Dashboards can be shared with customers or third parties, granting access only to relevant data.
01 / Open integration
The platform receives data via standard protocols (MQTT, LoRaWAN, NB-IoT, HTTP), compatible with the acquisition electronics already described in the product pages. Data can be exported for external analysis or integration with other management systems.
02 / Typical applications
Tell us about the structure to monitor: we will propose the best-suited configuration.
Request a demo or quote